The need for risk scores
Keeping up with the evolution of attacks requires introducing new and more advanced detection methods on a regular basis. Each method is designed to evaluate traffic from different angles in order to detect various attack vectors. Some of the detection methods are designed to look for very deterministic signatures that are only seen in attack traffic and are very accurate. But as attackers become more advanced and learn to blend in with the legitimate traffic, we have to develop advanced detection methods as well as rely on a collection of signals that have various degrees of accuracy.
Combining the outcome of each detection method into a risk score engine helps make the system easier to maintain and operate as it grows. The risk score engine takes care of categorizing and defining the risk associated with a session. In some cases, multiple attack vectors may be detected on a session which will categorize it as high risk. In other cases, a collection of minor anomalies may cause a session to be categorized as medium risk. Risk scoring helps eliminate some of the complexity of the detection process, make the product easier to understand and maintain as well as ensure that the response strategy applied is proportional to the risk associated with the session.
An illustration of risk score
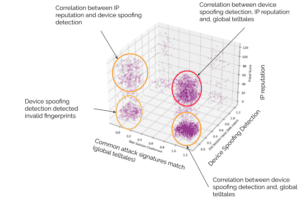
To illustrate how risk scoring works, let’s consider the 3D plot below representing how traffic that has been confirmed as malicious by a customer is detected by three major methods from the Arkose Labs detection engine:
- Global telltales (X-axis) detects common known bad signatures, a value of 1 indicates that the condition monitored by the telltale was found in the request
- IP reputation (Y-axis), a value of 100 indicates an IP with a bad reputation.
- Device spoofing detection (Z-axis) lookup against the device intelligence engine, a value of 0 represents no match, which is strong evidence that the fingerprint received is invalid

We can clearly see 4 clusters, each point corresponds to a malicious request. As we can see, some requests are only flagged by a single method (circled in yellow), others are flagged by 2 methods (circled in orange), while a large cluster is flagged by all methods (circled in red). Even if the accuracy of individual methods is not guaranteed, it is clear that requests flagged by 2 or more methods should be considered higher risk and challenged with more pressure compared to the ones that are only flagged by a single method.
Classification and categorization
The risk score model takes into consideration the risk associated with the anomaly but also the velocity at which it is encountered. For example, seeing a handful of requests with an invalid fingerprint represents a low risk compared to seeing the same anomaly at a rate of 100 requests per minute. The table below shows a high-level representation of how the risk score is defined.
| Detection | Anomaly velocity | Risk Classification |
| 1 anomaly detected | Low | Low |
| Medium | Medium | |
| High | High | |
| 2 anomalies detected | Low | Medium |
| Medium, High | High | |
| 3 anomalies detected | Low, Medium, High | High |
The anomalous traffic is further categorized between standard bots (the most common botnets that spoofs their fingerprint and spread their attacks through proxy or VPN services), advanced bots (headless browsers or sophisticated botnets able to produce a valid fingerprint), fraud farms (captcha solving services) and human fraud (suspicious traffic likely produced by human interaction). The categorization depends on the method contributing to the risk score.
Current and future detection methods are assigned a default contributing score between 0 and 100. Let’s consider IP reputation: a request coming from an IP address that is known to be a proxy service or a VPN will be flagged. However, because the usage of proxy and VPN services is common amongst privacy-conscious Internet users, it will only be given a contributing score of 10. However, requests with an invalid fingerprint (flagged by the device spoofing detection) coming at high velocity will be given a contributing score of 80. Individual contributing scores will be processed through the risk scoring function which will compute the resulting risk score for the request.
Transparency
The new risk score model has been defined through evaluating several possible functions and in the end, we settled for the one that provided the most consistent accuracy and classification across customers. The model may be adjusted as needed over time so as to preserve the most optimal accuracy. Converting the outcome of the detection into a risk score doesn’t mean the system becomes more opaque. Along with the risk score, Arkose Labs provides evidence of the anomalies found with their respective contributing score but also the classification and categorization. The information is made available to customers through the real-time logging API and the verify API. The dashboard in the new control center will also soon be updated to reflect the new risk score information.
Conclusion
The new risk score model makes the Arkose Labs product more flexible, easier to maintain, consume and understand than ever before. It also opens up a lot of opportunities for self-serviceability and expansion of the detection engine.

